The increasing awareness of climate change and global warming leads to an increasing number of people who start to pay attention to green house gases(GHG) emissions, especially CO2. Electricity generation as a significant source of CO2 emissions has gotten lots of discussion. Advocating to use renewable energy to replace fossil fuels is one of the main recommendations for cutting electricity-related emissions.
Based on the definition given by Natural Resources Canada, “Renewable energy is energy derived from natural processes that are replenished at a rate that is equal to or faster than the rate at which they are consumed… These resources include moving water, wind, biomass, solar, geothermal, and ocean energy.” [1] Among those resources, wind and solar are the most popular ones.
Wind and solar energy is always associated with some positive words such as clean, green, sustainable etc., which makes people believe using these two types of energy can benefit our communities. Apart from that, the tendency of news reports in media is to emphasize the pros of applying wind and solar energy, and the public believe that the development of the energy has made big progress based on news. The enthusiasm for these two types of energy leads to the appearance of more green projects, green conferences, green workshops and green organizations.
Why are people crazy about wind and solar power? Is it because these two kinds of energy are seen as positive to the environment? Is it easy to link “wind and solar” to “nature”, “green” and “clean”?
The main reason why wind and solar energy receive so much support is because people believe they are clean. People believe that if we can totally rely on wind and solar power, CO2 emissions from electricity will be very low. But is it possible?
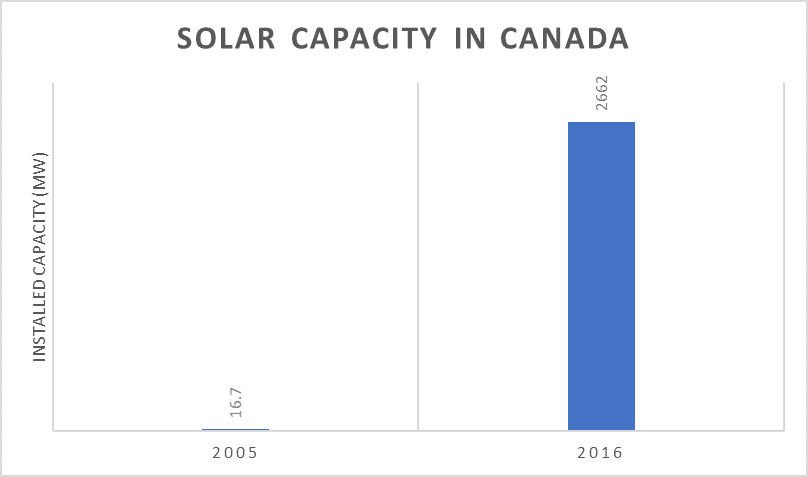
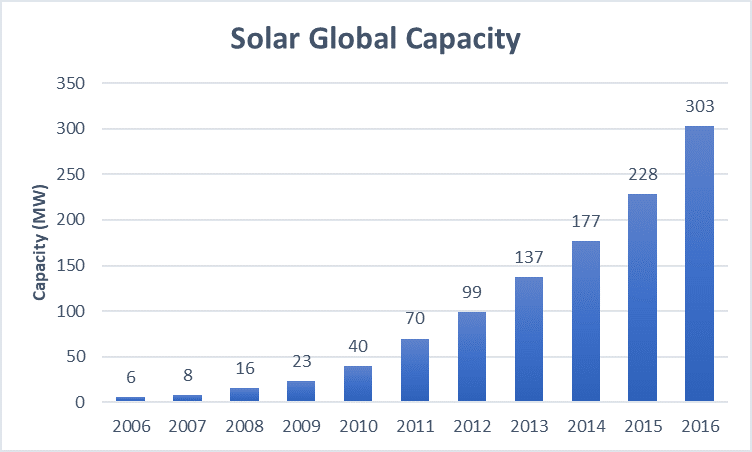
The public confidence in wind and solar power is increasing because people believe the respective technologies are developing and improving. As Figure 1 shows, in Canada, the installed solar capacity in 2016 (2662 MW) was more than 758 times the number for 2005 (16.7 MW). The installed global solar capacity (Figure 2) in 2016 was 303 MW which was around 50 times the capacity in 2006 (6 MW).
Wind and solar supporters may also point out that the price of wind and solar power is cheaper. News stories with titles such as “Low costs of solar power & wind power crush coal, crush nuclear, & beat natural gas” or “solar and wind are now the cheapest energy around- unless you need to store it” are commonplace. But are they true?
Since there are so many questions about solar and wind power, let’s discuss those questions in the following paragraphs.
Q1: Is it possible to meet energy demand by applying wind and solar power only?
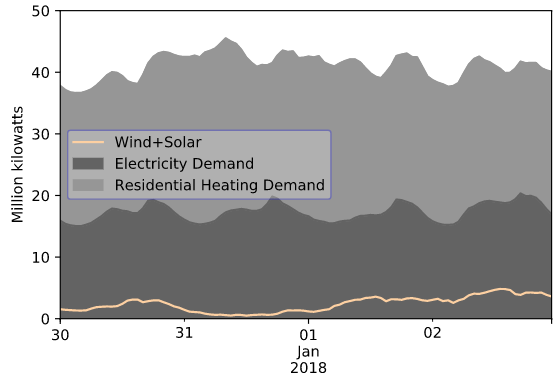
Let’s discuss this based on an example. Figure 5 shows that the wind and solar power during the period from December 30, 2017 to January 2, 2018 was much lower than just the electricity demand in Ontario.
Let’s do a simplified calculation based on Table 1 to calculate how much area we need to install wind turbines in order to meet Ontario’s electricity demand.
Table 1.
| Average Ontario electricity demand in 2016 [5] | 15,595 MW | |
| Wind farm: Amaranth [5] | Max “capability” in 2016 | 187 MW |
| Total output | 421,788 MWh | |
| capacity factor | 25.68% | |
Assume the average electric demand of Ontario is 15,595 MW.
Assume every wind farm in Ontario is similar to the Melancthon-Amaranth wind farm located near Shelburne, Ontario. The area of Melancthon-Amaranth wind farm is 4,860 hectares (48.6 square kilometres), the wind capacity of this farm is 200 MW [6] and the maximum capability of this farm in 2016 was 187 MW. In 2016, the capacity factor of Melancthon-Amaranth wind farm was 25.68%.
Assume the capacity factor for all wind farms in Ontario is 30%.
Ontario annual electric demand:
![]()
The territory needed for 1MW capacity:
![]()
Annual energy output of the territory with 1MW capacity:
![]()
Total area of wind farms needed:
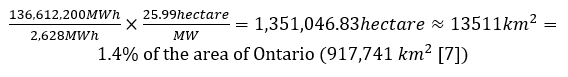
As the calculation shows, to meet energy demand, 1.4% of the land of Ontario needs to be used to install wind turbines. However, with nuclear power, we only need 0.0037% land on Ontario (34 square kilometers) to meet the demand.
In addition, the electric demand is not a constant in the real world, and wind and solar power is not stable. No wind power will be created if there is no wind or the wind is not strong enough. Absolutely no solar power in the evening, because there is no sun during that time. Therefore, even through we could increase the capacity, it is still extremely difficult if not impossible to meet the demand all the time.
Q2: Is it true that the development of wind and solar power has made big progress?
The answer is NO.
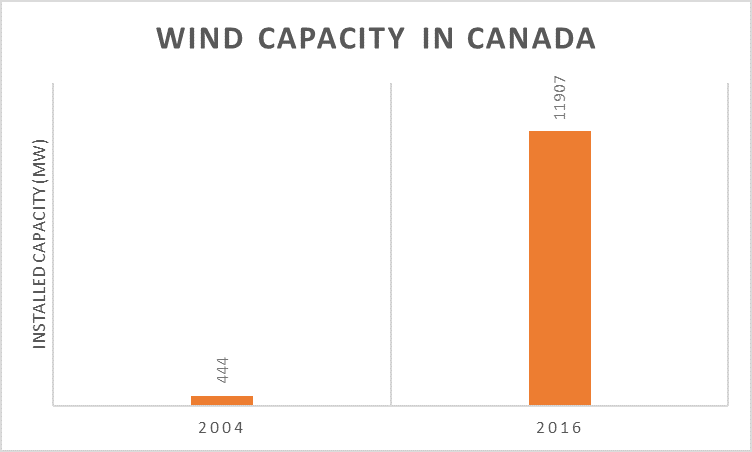
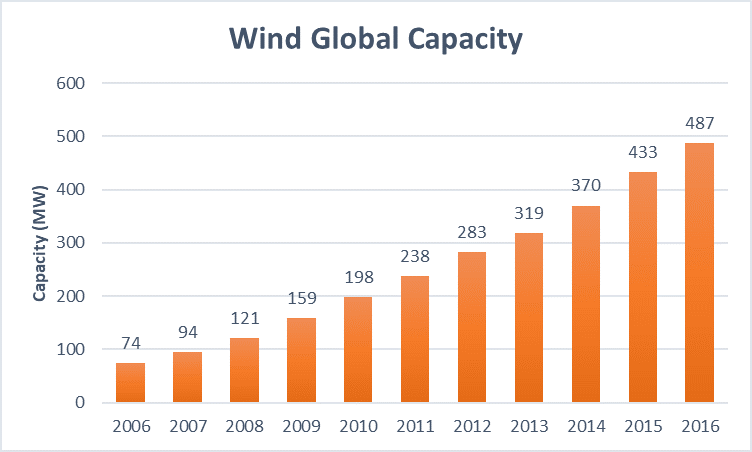
People may say yes based on Figure 1-4, because of the big difference of capacity during a 10-year period. However, capacity doesn’t equal to actual power generation. Capacity is the maximum power that can be generated in power stations. As I mentioned in the last question, the generation of wind and solar power is not stable and it is not able to meet moment by moment demand. Generation efficiency should be the standard used to evaluate wind and solar power’s development, not capacity. When there is a significant increase in wind and solar power generation, which is due to generation efficiency, not power station expansion, we can say wind and solar power has made big progress.
Q3: is it true that wind and solar power can make electricity cheaper?
The answer is NO.
Here is an example about Ontario’s electricity. Nuclear generates more than 50% Ontario’s electricity and hydro generates around 30% Ontario’s electricity [8]. The percentages of electricity generated from wind and solar are much lower, around 8% and 2% respectively [8]. However, as Table 2 shows, wind or solar power’s price is much higher than nuclear or hydro, which means more electricity generated from wind and solar, higher electricity prices.
Table 2. Prices of some electricity sources at ON, Canada. [9]
| Sources | Price (¢/kWh) |
| Nuclear | 6.22 |
| Hydro | 4.84 |
| Gas/Oil | 15.35 |
| Wind | 11.99 |
| Solar | 49.11 |
| Bioenergy | 20 |
| Coal | 7 |
In my opinion, it is not a good time to promote wind and solar power and increase the installed capacity. The goal of applying wind and solar power can be achieved by using nuclear and the spending on nuclear is much lower than those two kinds of renewable energy. If a problem can be solved by spending less money, why do we waste money?
Let’s do a multiple choice:
In one company, there are Team A and Team B. Team A has 5 employees and Team B has 20 employees. The employees in Team A have high work efficiency, can work 40 hours per week and their salary is $14/h (Nuclear). The employees in Team B have lower work efficiency, only can work 15 hours per week and their salary is $30/h (Wind and solar). As well, the upper limit on Team B’s work efficiency will always fall well below the lower limit of Team A’s efficiency. There is a project which needs to be finished in one week. Team A can finish the project on time, while Team B needs more than three weeks to finish it. If you want to help the company finish the project, what suggestions will you give to the company owner?
A. Use Team A (Use nuclear).
B. Use Team B, but recruiting more employees having same qualifications as existing Team B employees for Team B (Increase wind and solar capacity).
C. Before using Team B, train Team B to improve their work efficiency (Study to improve the technology of wind and solar power).
D. Others.
I will choose A. What’s your opinion?
References
[1] Government of Canada, “About Renewable Energy,” 13 December 2017. [Online]. Available: http://www.nrcan.gc.ca/energy/renewable-electricity/7295. [2] Government of Canada, “Renewable energy facts,” 4 January 2018. [Online]. Available: http://www.nrcan.gc.ca/energy/facts/renewable-energy/20069#L7. [3] REN21, “Renewables 2017 Global Status Report,” 2017. [4] S. E. Aplin, “Renewable energy in the Ontario cold snap: a technicolour dream, debunked in grayscale,” 4 January 2018. [Online]. Available: http://canadianenergyissues.com/2018/01/04/renewable-energy-in-the-ontario-cold-snap-a-technicolour-dream-debunked-in-grayscale/. [5] IESO, “Generator output and capability,” IESO, [Online]. Available: http://reports.ieso.ca/public/GenOutputCapability/. [6] S. E. Aplin, “Economic activity in Grey-Bruce: the right kind of green jobs,” September 2010. [Online]. Available: http://canadianenergyissues.com/2010/09/01/economic-activity-in-grey-bruce-the-right-kind-of-green-jobs/. [7] Government of Canada, “Land and freshwater area, by province and territory,” 1 2 2005. [Online]. Available: http://www.statcan.gc.ca/tables-tableaux/sum-som/l01/cst01/phys01-eng.htm. [8] S. E. Aplin, “EmissionTrak,” EmissionTrak, 2018. [Online]. Available: http://canadianenergyissues.com/CNA8/CNAM/clean_today.php. [9] Office of the Auditor General of Ontario, “2015 Annual Report of the Office of the Auditor General of Ontario,” Queen’s Printer for Ontario, 2015.

