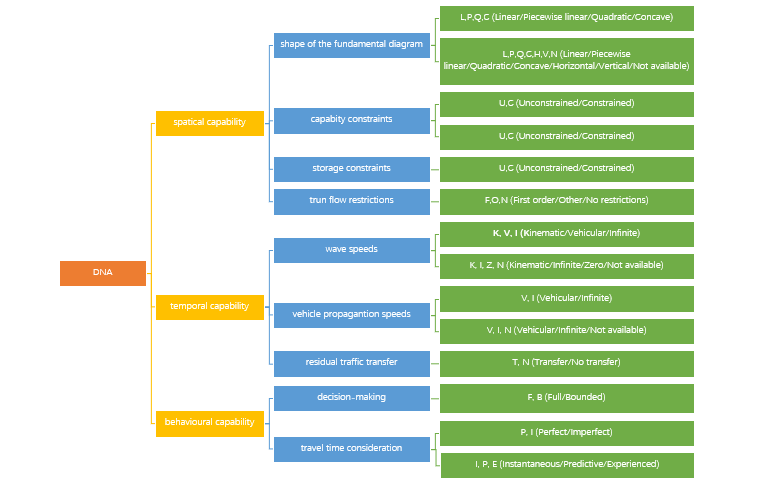
The article under review is about traffic assignment models which are used to forecast traffic flows and travel times for strategic (long-term) transport planning and project appraisal [1]. To review and classify traffic assignment models, the authors analogize them to genetics. The article says every traffic assignment model has the same DNA (theoretical framework) for strategic transport planning, but different genes (capability). There are three genes: spatial capability, temporal capability and behavioural capability, which are defined to describe models. Each capability contains three or four assumptions which the authors liken to nucleotides. In addition, each assumption has different features, and the authors use the first letter of each feature to code the feature [1]. For example, one assumption for spatial capability is shape of the fundamental diagram which could be linear, piecewise linear, quadratic or concave, so the code for this assumption could be L, P, Q or C. Then the authors use codes to describe the function of different traffic assignment models. Figure 1 shows how the authors analogize the traffic assignment models structures with DNA.
When reading the paper, I was thinking what the differences are between traffic assignment models and traffic simulation models, such as VISSIM and Synchro.
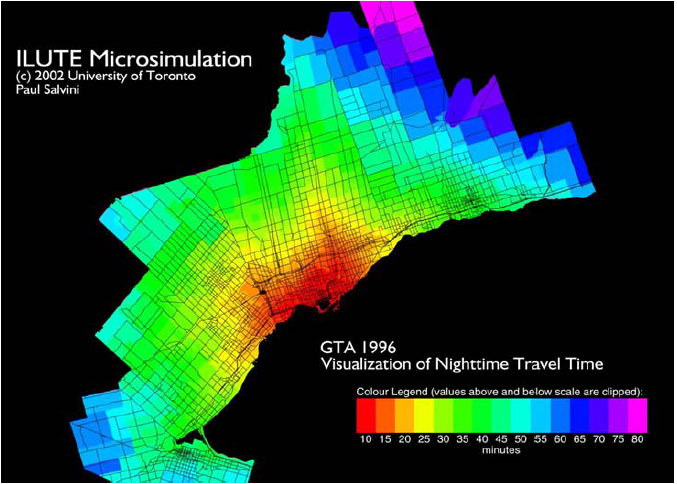
One example of traffic assignment models is Integrated Land Use, Transportation, Environment (ILUTS) which is under development for urban transportation [4]. After reading some reports about ILUTS, I think it is a model based on human behaviour studies.
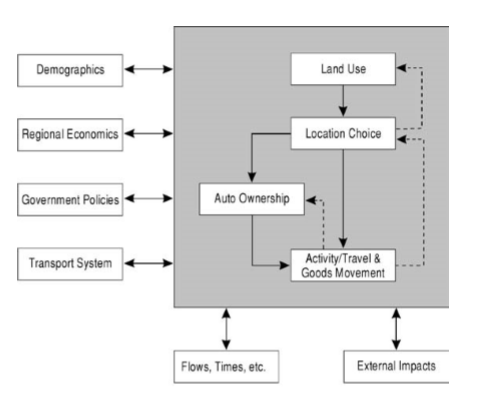
Table 1. ILUTE classes [5].
| Architectural Classes: |
| • Application (the parent class of the software) • Database Administrator (reads and writes the system state to disk) • World (the simulated system) |
| Agents: |
| • Persons (each individual person is modelled by the system) • Households (a set of persons who live in the same dwelling unit) • Firms, Establishments (represents the decision-making of a company) • Property Owner |
| Physical Classes: |
| • Transportation Network (multi-modal network consisting of Nodes and Links) • Travel Times (by mode: e.g. walk, bike, auto, transit, etc.) • Vehicles • Buildings, Dwelling Units • Location (a geographic point), Neighbourhood (a boundary with common traits) • Monetary Values (capture monetary values as a date-value pair: e.g. $1.00 in 1986) • Schedule |
| Sub-models: |
| • Housing Market Sub-model (determines if and where a household will move) • Auto Transactions Sub-model (determines if a household will buy/sell/trade an auto) • Activity Sub-model (generates activities in time and space for each person) • Output Sub-model • Demographic Sub-model (manages births, deaths, in and out migration, marriage, etc.) |
| Supporting Classes: |
| • Bid (a financial bid on a transaction) • Job • Market Pools (track participation in the marriage and housing markets) • Market Moderators (process transactions within a given market) • Simulated Object (anything updated over time) • Simulation Date (current date/time of the simulation) • Spatial Object (anything with a Location) • Stressors (things that cause stress to agents: e.g. travel time, financial problems) • Stress Manager (tracks, manages, and resolves “stress” in the life of the agents) • Temporal Data Manager (manages time-varying data sets) |
Based on some reports about simulation models, the input data is related to traffic. For example, in a report of VISSIM model development and the calibration process for the US 231 project, the input data includes geometric data from google maps, traffic control data from the Kentucky Transportation Cabinet, and traffic flow data [7]. Although the input data of ILUTS is not given by Salvini and Miller, I think besides transportation data, data about infrastructure, such as location of buildings and capacity of buildings, is also needed.
References
[1] Bilemer, M. C. J., Raadsen, M. P. H., Brederode, L. J. N., Bell, M. G. H., Wismans, L. J. J. and Smith, M. J., “Genetics of traffic assignment models for strtegic transport planning,” Transport Reviews, vol. 37, pp. 56-78, 2017.[2] G. H. Reference, “What is DNA,” Genetics Home Reference, 15 May 2018.
[3] National Center for Biotechnology Information, “Genetics Review,” National Center for Biotechnology Information, 30 March 2001.
[4] E. J. Miller, “THE INTEGRATED LAND USE, TRANSPORTATION, ENVIRONMENT (ILUTE) MICROSIMULATION MODELLING SYSTEM: DESCRIPTION & CURRENT STATUS,” 2001.
[5] Salvini, P. and Miller, E. J., “ILUTE: An Operational Prototype of a Comprehensive Microsimulation Model of Urban Systems,” Networks and Spatial Economics, vol. 5, pp. 217-234, 2005.
[6] P. A. Salvini, “THE ARCHITECTURAL DESIGN OF “ILUTE”, AN INTEGRATED DYNAMIC MICROS IMULATION MODELING FRAMEWORK,” National Library of Canada, Toronto, 1998.
[7] SDM Smith, “VISSIM Development and Calibration Report-US 231 Scottsville Road Scoping and Traffic Operations Study,” 2014.

